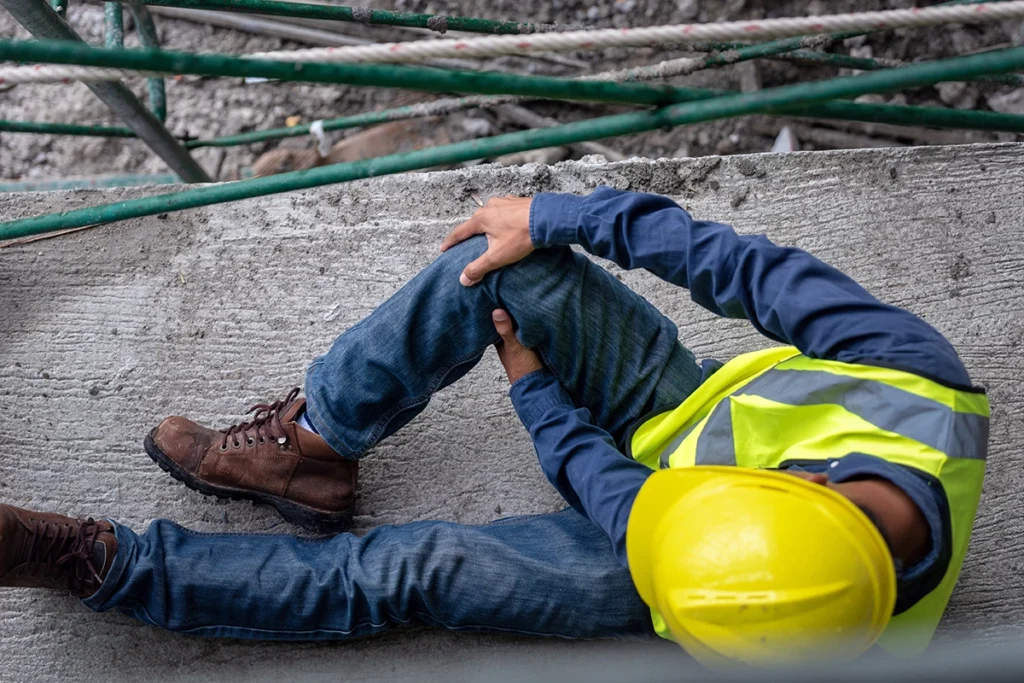

As we look into the data on injuries and fatalities across the United States, let’s start with the good news: it’s generally becoming safer to be a worker in the U.S. In almost every state the number of injuries in the workplace has been on a downward trend during the last decade. But while progress has been made, there’s still work to be done.
Our research shows that Washington, California, and Alaska top the rankings for the states with the most recorded non-fatal injuries, making them among the most dangerous to work in.
There are over 2.8 million nonfatal workplace accidents and injuries reported by private industry employers in the US alone each year (USA.Gov). To find out what this really costs, and understand the impact across the country, we gathered data from all 50 states to reveal the following:
Workplace injuries bring a lot of extra costs, with a per-person average of approximately 11 lost workdays.
But with statistics like these, which states took the biggest hit?
Washington, California, and Alaska recorded an average of 3.5 non-fatal injuries per 100 workers. This means that there are a hefty 3,500 injuries per 100,000 workers in each of these states.
For every 100 workers, Washington averaged 1.5 cases with days away from work, California averaged 1.6 cases with days away from work, and Alaska came in at 1.8 cases per 100 workers that required days away from work due to injury. Therefore, per 100,000 people, this state would see 1,800 cases where individuals missed work because of a non-fatal injury.
So, while there’s undoubtedly an impact across the country, which industries report the most accidents?
Topping the list is healthcare and social assistance, having a staggering 5.5 reported cases recorded per 100 people, and within these two industries, an average of 3 cases resulting in days off from work. With over 22 million Americans working in this industry, that is a significant number of people impacted by non-fatal injuries missing work. In total, we estimate the impact is equivalent to over 1.2 million reported injuries per year.
Coming in at number two is the agriculture, forestry, fishing and hunting industry. As physically intensive and laborious jobs, workers in this sector had some of the highest cases, with 4.6 injuries reported per every 100 workers.
In the US alone, there are approximately 3.5 million people working in the agriculture, forestry, fishing and hunting industry. Subsequently, the impact of non-fatal injuries equals around 161,000 cases, of which, 66,000 cases required days off work in just this sector alone.
All in all, Texas had the lowest number of non-fatal injury cases per 100 people, coming in at an average of 2.1 cases per 100 people or 2,100 cases per 100,000. In total, this meant an average of less than 1 day (0.8) was taken off as a result of a non-fatal workplace injury. Compared to states like California, there were 50% fewer cases in Texas.
It will likely come as no surprise that finance and insurance are the safest industries to work in with extremely low rates of non-fatal injury cases. In this industry, there were a mere 0.3 cases per 100 people, meaning incidents are thankfully few and far between.
When it comes to individual states, here is our leaderboard to highlight the most and least dangerous to work in:
Most dangerous states to work in:
Safest states to work in:
To break it down by industry, here are the most and least dangerous sectors to work in:
To create a ranking of the most and least safe states to work in, data was collected from the US Bureau of Labor Statistics. This data provided access to the total recordable cases of non-fatal injuries, the cases with days away from work and then the split by industry. This ranking was then based on the US states that made their most recent updated 2020 statistics public, which was then ranked highest to lowest based on these metrics.
Share