
Together, increased regulatory scrutiny and a plateauing fatality curve are pushing EHS professionals to rethink how they identify, score and monitor risk. Counting incidents after they happen is no longer enough to satisfy regulators or to move the needle on outcomes that have flatlined for years. The programs breaking through that plateau share a common trait: they identify hazards early, track the effectiveness of their controls in real time and give insight into where risk is building.
However, as EHS professionals push for a more structured, evidence-based way of working, it’s important to make sure the foundational knowledge of risk management isn’t forgotten. The tools below serve as the foundation for a proactive, successful risk management program.
Often used alongside risk assessments, a risk matrix is a tool used to help prioritize risks and identify which ones require the strictest mitigative controls. grid plots risk likelihood on one axis and severity on the other.
One axis of the matrix measures the likelihood that the hazard will occur, and the other axis measures the severity of the incident if it does. Together, they determine the overall consequence of a workplace risk.
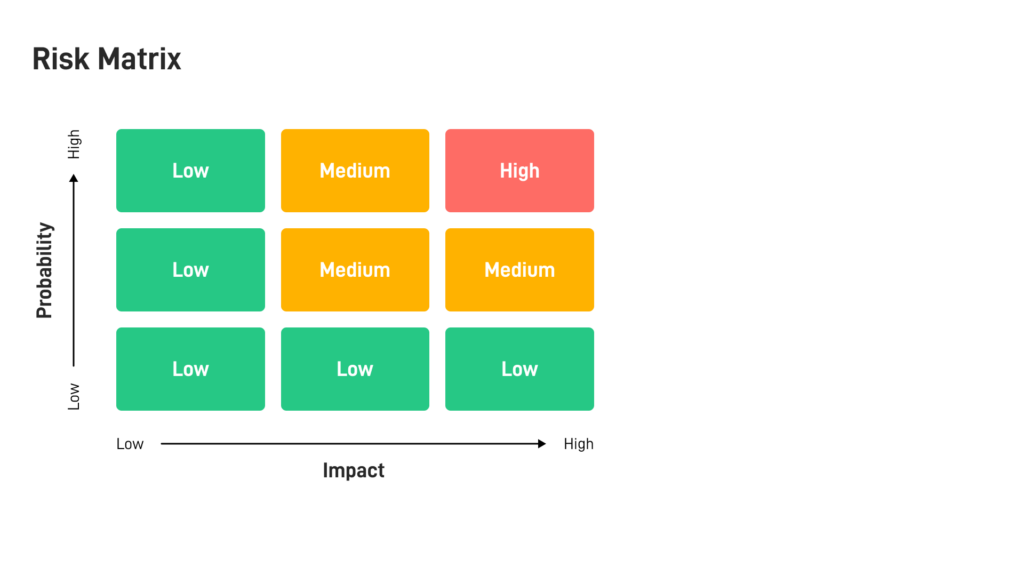
While a risk matrix provides a good starting point to help prioritize risks and identify which hazards require the strictest critical controls, it is important to point out their flawed nature. Risk matrices rely on human judgement and, whether subconscious or conscious, bias. Therefore, it’s important to use risk matrixes in conjunction with other risk management tools and reduce bias in the assessment process.
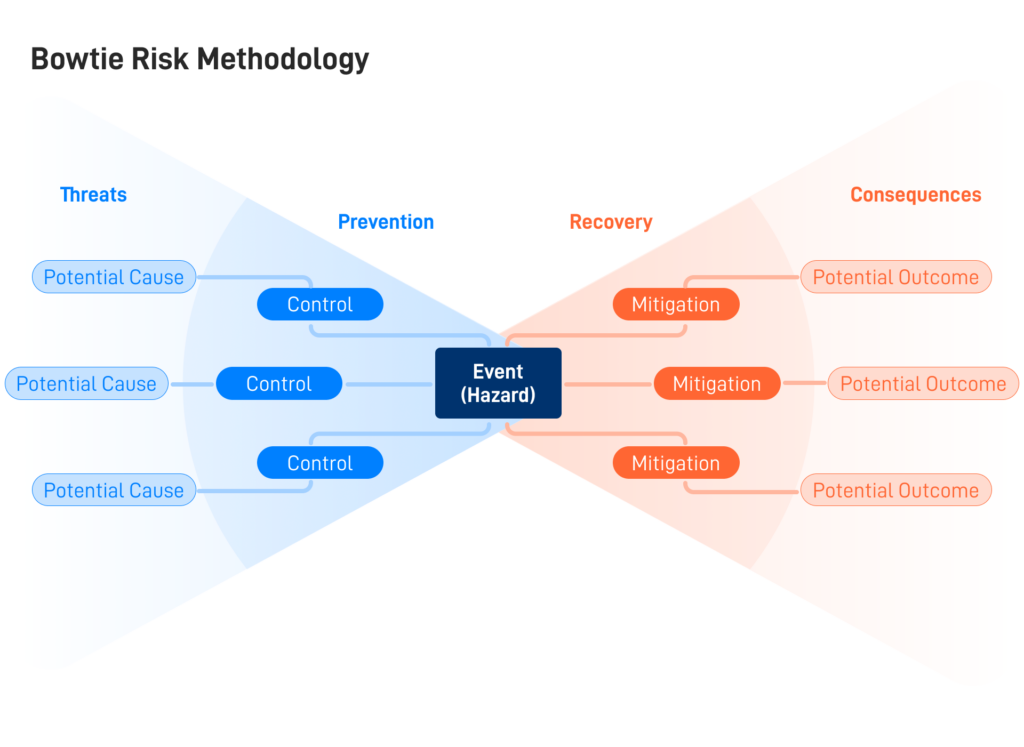
A risk bowtie is a diagram built to illustrate the threats, preventative barriers, consequences and mitigation controls of any given hazard. The diagram gets its name from its shape: two triangles meeting at a center point, resembling a bowtie once every part is added:
An important part of the bowtie risk methodology is that creating this diagram helps identify which controls are “critical,” meaning the absence of them significantly increases the likelihood of a serious injury or fatality.
A risk register is a structured log of every identified risk facing an organization or site, along with its description, potential severity, current controls and the responsible owner.
A well-built register typically documents:
Registers create an audit trail that regulators and insurers increasingly expect to see, showing that a risk was identified, assessed, assigned and tracked over time.
The most common failure with risk registers is letting them go forgotten. While it may be easy to document a risk and move on, effective risk registers serve as the catalyst for corrective and preventative actions.
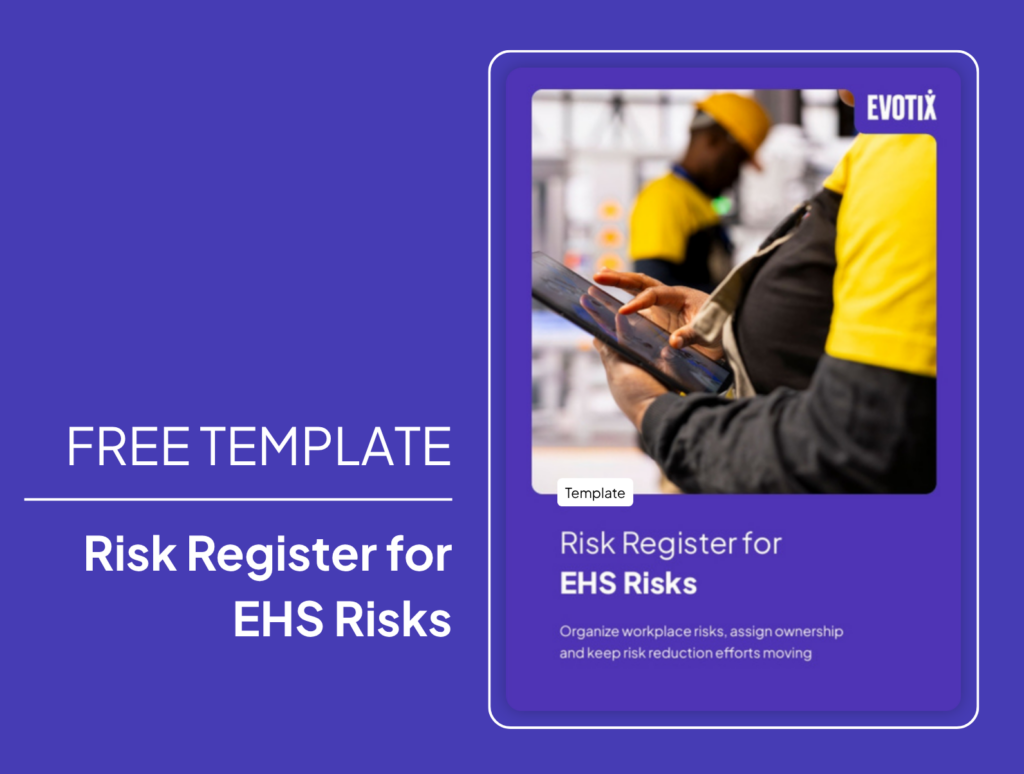
Download our free risk register template
Get a practical framework you can adapt to your organization’s EHS needs.
A key risk indicator, or KRI, is a metric that signals whether a specific risk warrants corrective or preventative actions. Common EHS KRI examples include:
KRIs work best by setting a threshold for each indicator that triggers a specific response. For example, if overdue corrective actions cross 15 percent, that should automatically trigger a management review. This ensures and encourages a proactive approach to risk management.
A risk assessment is the process of identifying hazards, evaluating how likely they are to cause harm and how severe that harm could be. It’s the starting point for almost every other tool on this list.
Most formal risk assessments follow a similar sequence:
There are two main types of risk assessments: qualitative and semi-quantitative. Learn about their differences here.
None of these tools work in isolation. Key risk indicators measure whether a risk hits the threshold for review. A risk assessment and matrix score that hazard consistently. A risk bowtie identifies the barriers that matter most for a given hazard. A risk register keeps it visible and assigned to an owner.
EHS leaders who build this kind of connected system spend less time reacting to incidents and more time proactively controlling risk. That’s the real shift happening across the profession right now: demonstrating, with real data, that workplace risk is under control.
Want to learn more? For more information, consult our library of risk management resources:

Share