Stop wrestling spreadsheets. Get real-time visibility, interactive dashboards and automated reporting that help you move faster, stay compliant and prevent problems before they grow.
End the spreadsheet pain Evotix compiles everything for you from one system.
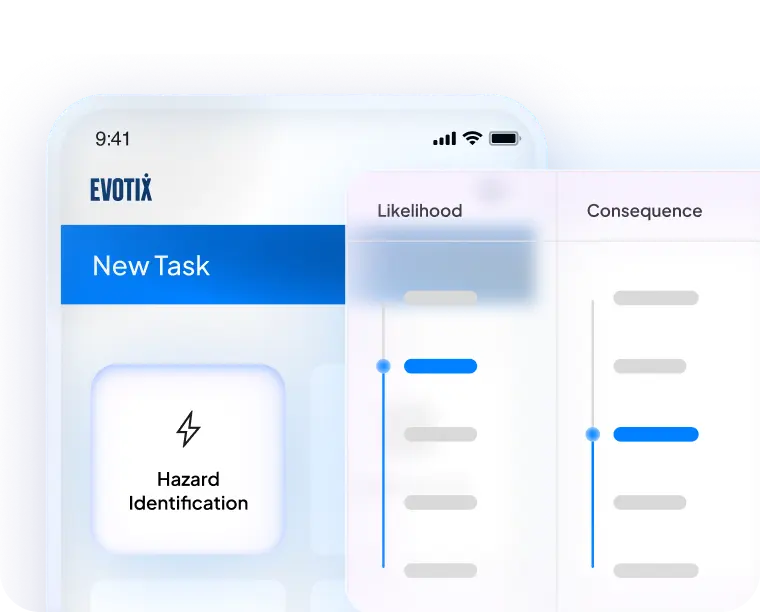
Understand the why
Drill into root causes without exporting a single CSV.
Make decisions grounded in evidence — No more “I think.” Only “Here’s what the data shows.”
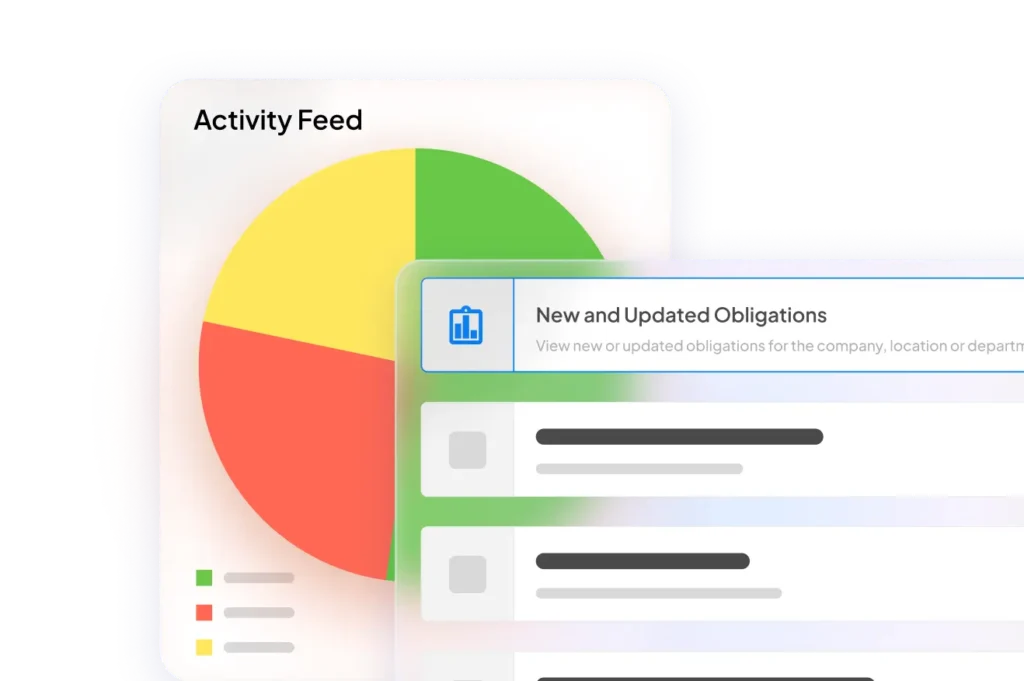
Drive accountability across your organization
Overdue actions, missing training and out-of-policy trends surface instantly.
Visibility that elevates every decision
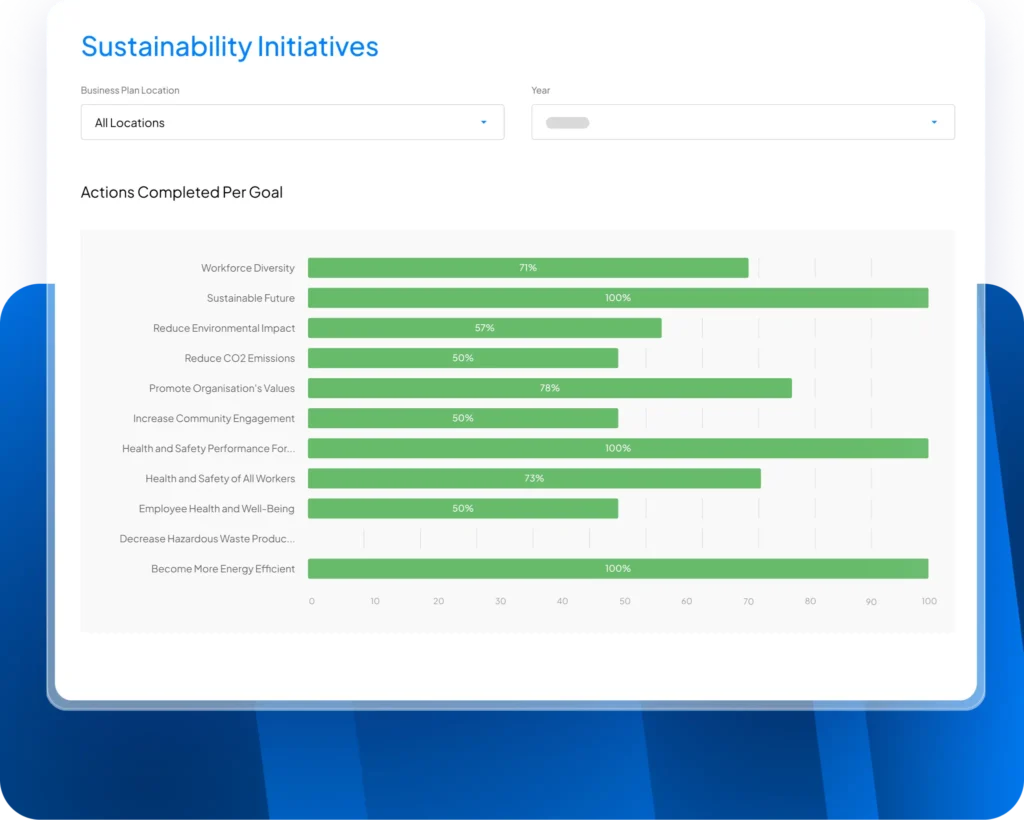
Board & executive reporting
Instantly generate leadership dashboards showing performance, risks and trends across the business.
Multi-site compliance tracking
See how every location performs — with site-specific scorecards you can compare side by side.
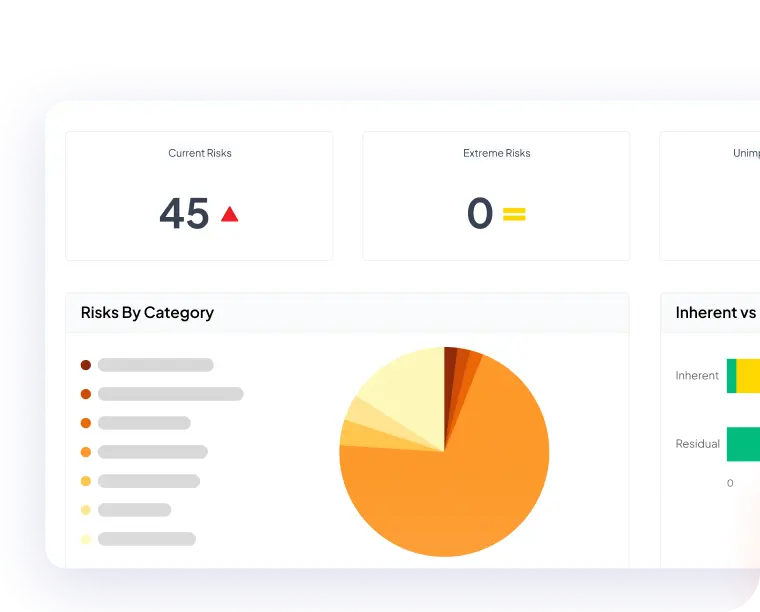
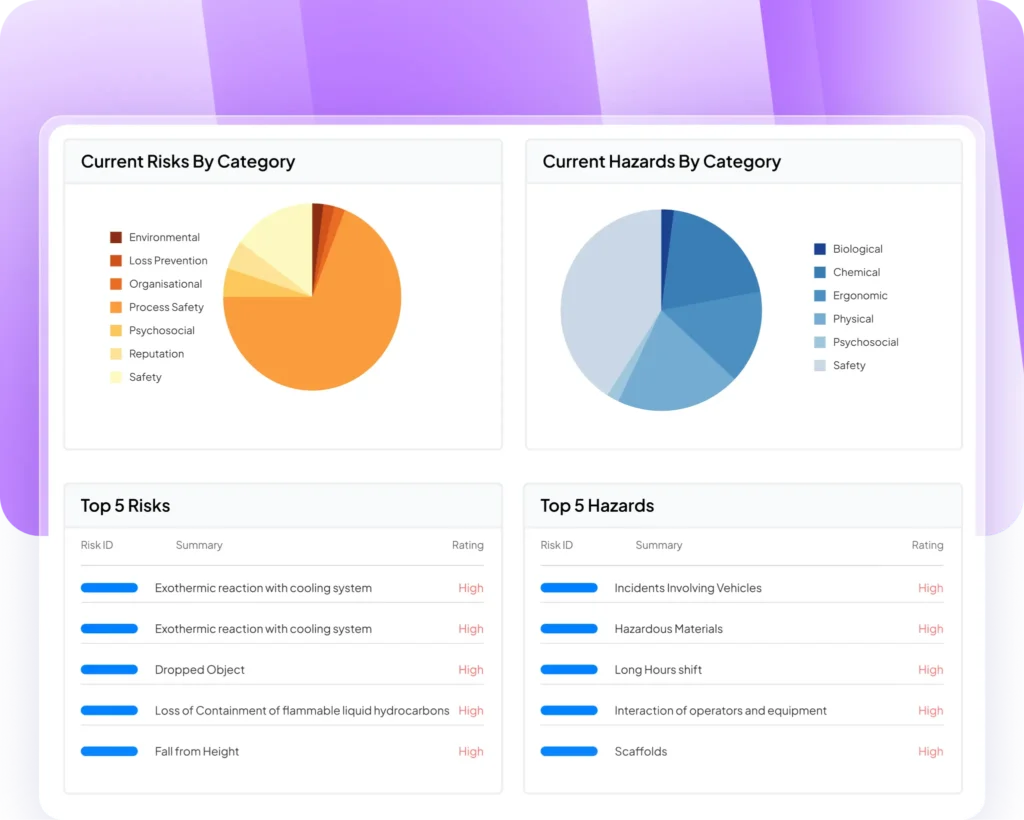
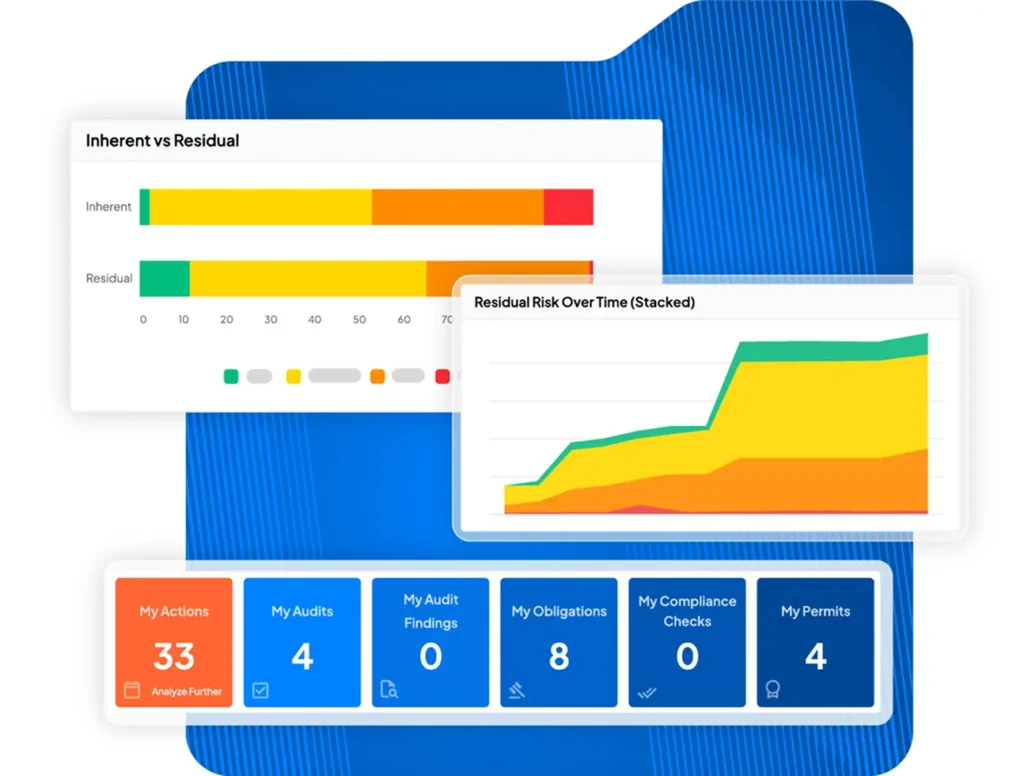
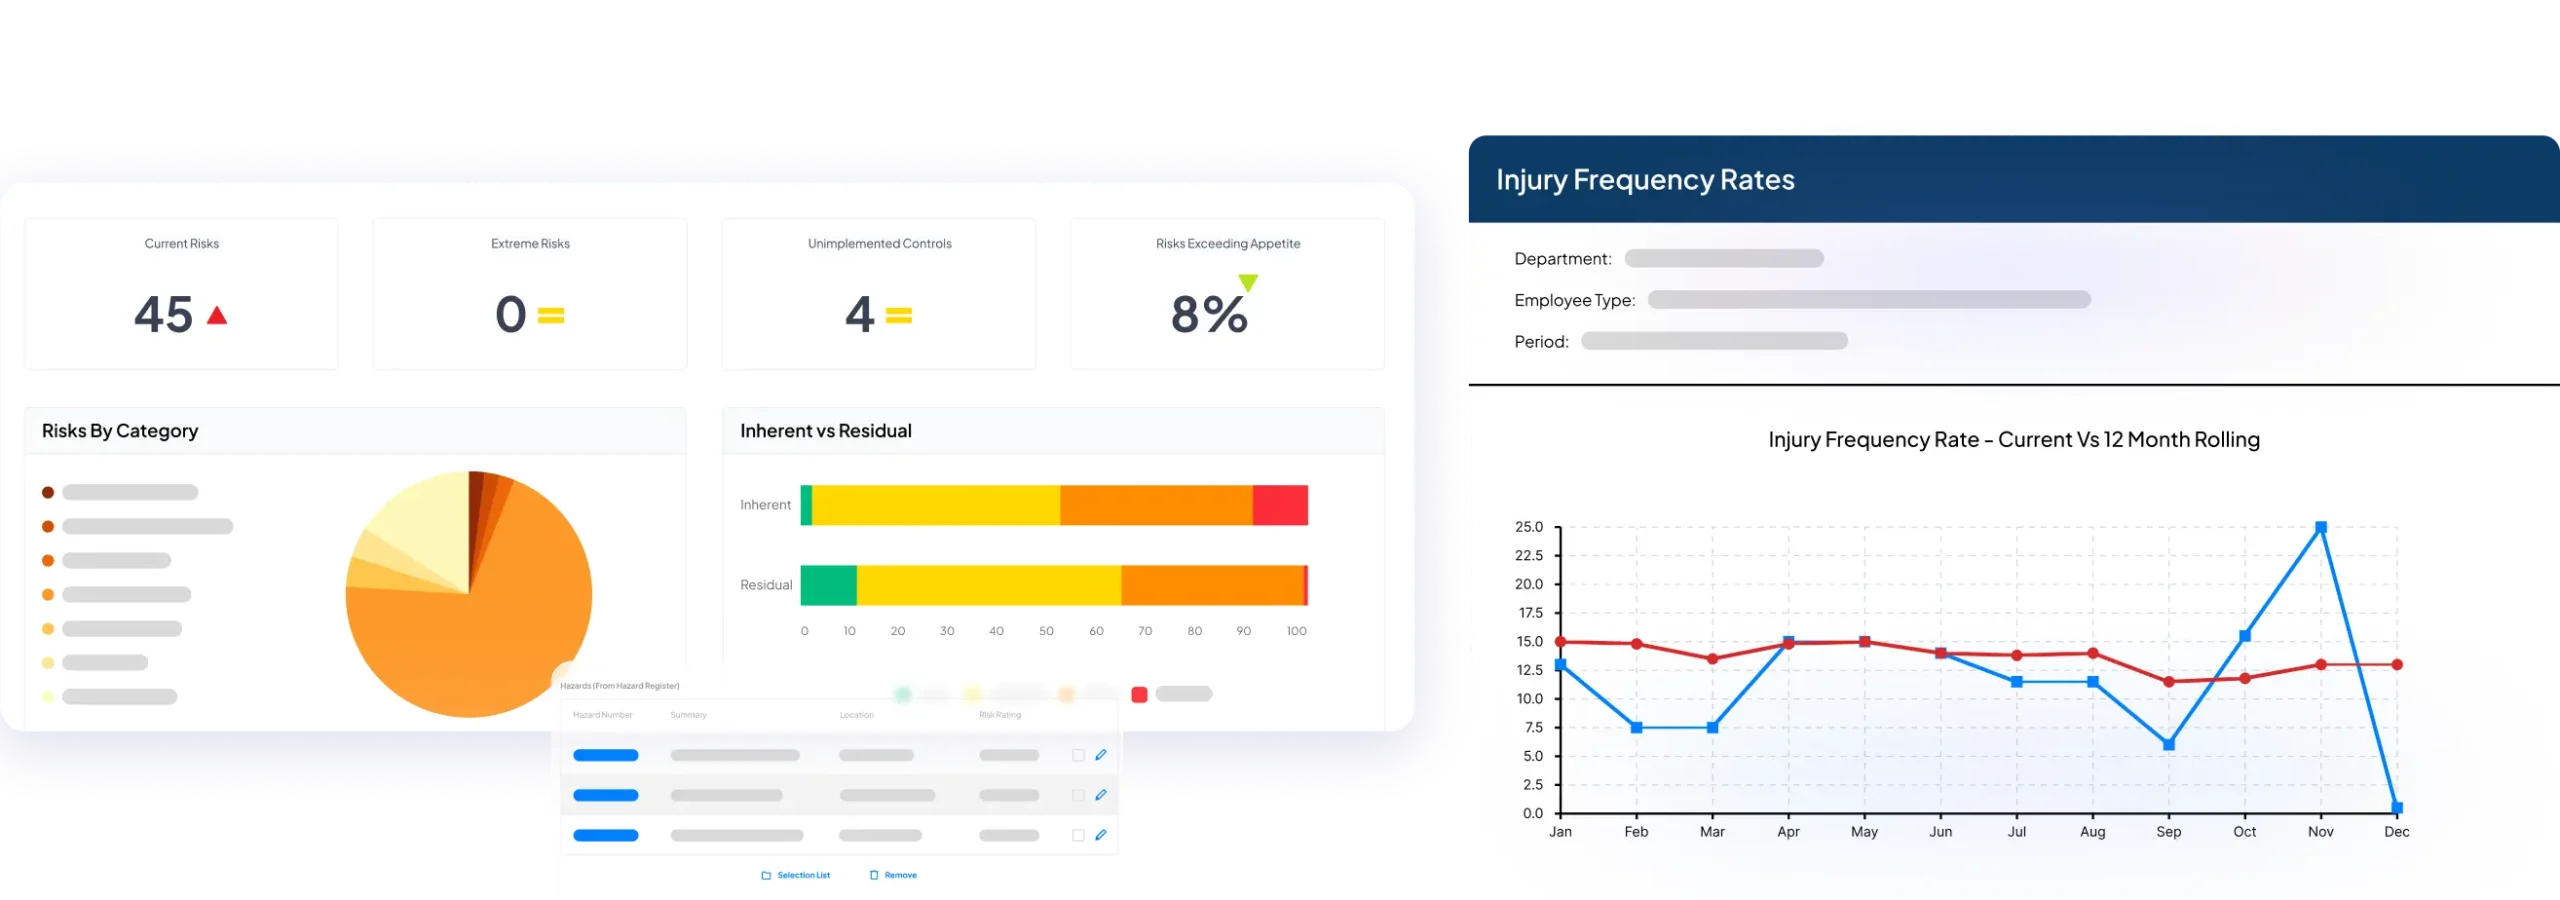
Risk management
See risks by category and home in on your biggest areas of exposure.
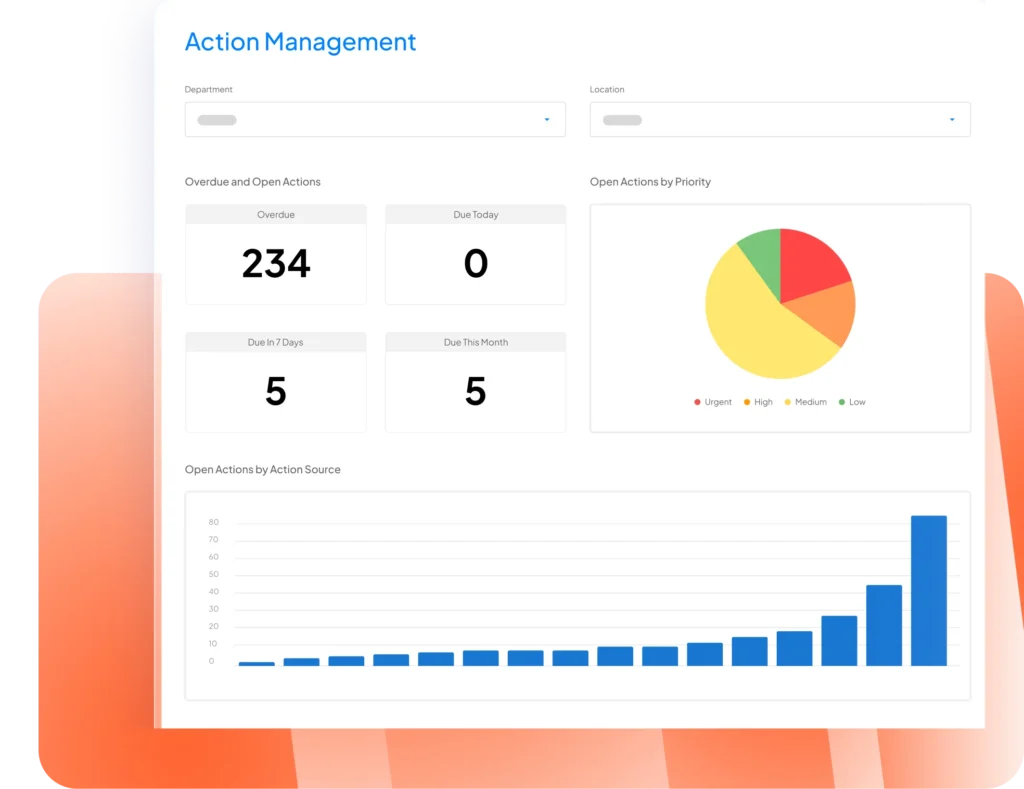
Action accountability
Know exactly who’s behind on critical actions and keep work moving.
Your data is powerful, but only if people can use it.
Evotix turns every incident, action, audit and training records into clear insight you can trust. No more manual reporting, fragmented tools or buried trends. Just one connected view of performance across your entire organization.
Dashboards built for real answers, not just pretty pictures
Explore your data in seconds
Click into any data point and the full dashboard updates instantly so you can see what’s driving your numbers.
Spot patterns before they become problems
Click into any data point and the full dashboard updates instantly so you can see what’s driving your numbers.
Pre-configured dashboards that flex to your strategy
Click into any data point and the full dashboard updates instantly so you can see what’s driving your numbers.
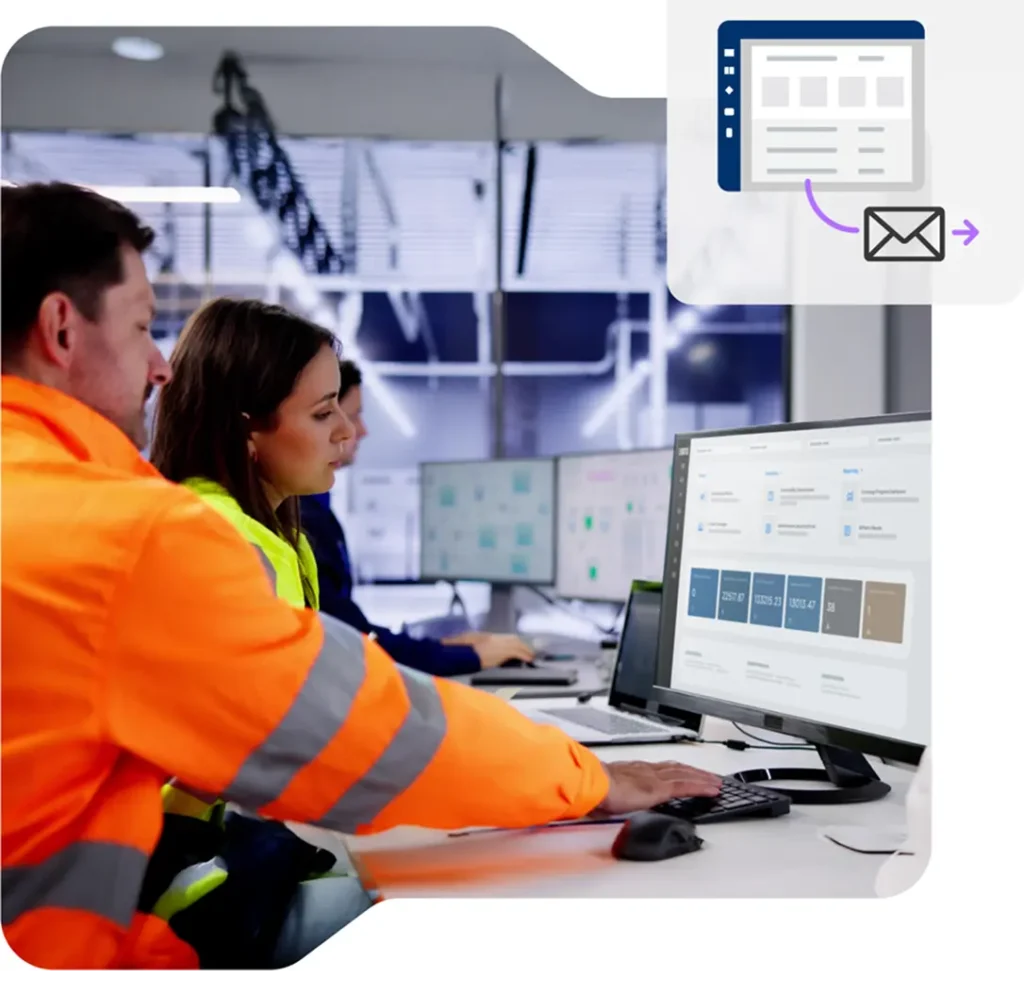
Reporting that runs itself
Schedule dashboards to send themselves – daily, weekly or monthly. Executives get clarity. Supervisors get accountability. Frontline teams get direction.
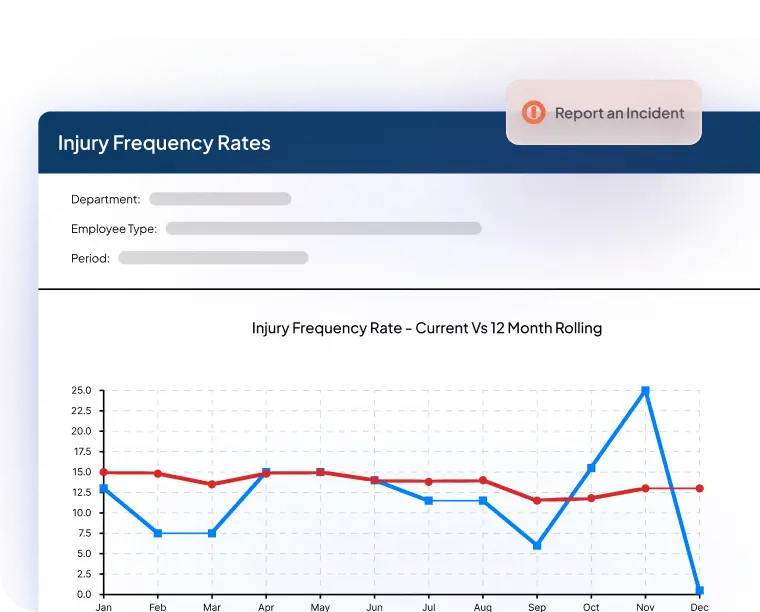
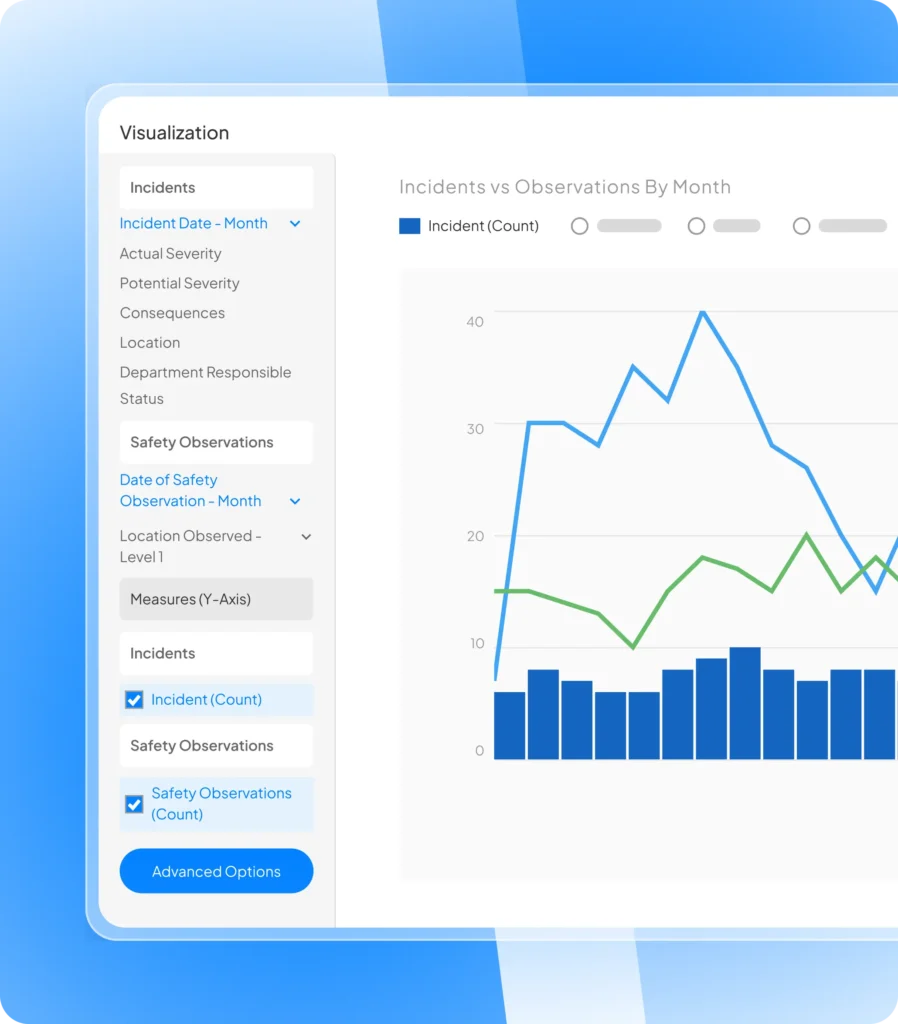
Visualizations that make trends impossible to ignore
Use charts, heat maps, scorecards and trend views to spot patterns at a glance and understand what needs attention now.
Realtime insights. No delays
As incidents are logged, actions closed and training completed, dashboards refresh automatically. You’re always looking at the truth — not last month’s export.